Audio Latency Test - output latency & A/V sync
An audio latency test examines delays in the playback and A/V sync path. GPADLAB reads the Web Audio API's browser-reported output latency estimate, runs three interactive click-and-flash sync trials, and can optionally estimate acoustic round-trip delay by playing a chirp and recording it through a microphone. The loopback result includes output, room, microphone, input, and browser processing, so it is not pure headphone or speaker latency. GPADLAB combines the signals into a site-defined 0-1000 Audio Latency Score.
Choose the audio paths to check
Read your browser's reported output latency
The Web Audio API can expose outputLatency, a browser-reported estimate of output-path latency for the active AudioContext. GPADLAB converts the value to milliseconds and displays it alongside baseLatency. What the value includes and how accurately it reflects the physical device path can vary by browser, operating system, driver, and output device.
Run the A/V sync perception test
A click and a flash play simultaneously on a 1.5-second loop. You drag a slider to shift the click forward or backward in time until they feel perfectly aligned. The absolute value of the offset you settle on is your personal A/V perception threshold - a number most users have never measured for themselves. The test runs three trials so we can take the median and report your consistency across them.
Optionally estimate acoustic round-trip delay via mic loopback
The optional loopback test plays a 200-millisecond frequency chirp and records it through your microphone. Cross-correlation estimates the elapsed acoustic round trip. That number includes browser scheduling, output hardware, room travel, microphone hardware, input processing, and the browser recording path, so it should be used as a combined-path estimate rather than ground truth for output-device latency alone.
Compose the four signals into a single score
Reported output latency carries 500 points (50%), mic loopback 200 (20%), perception offset 200 (20%), and perception consistency 100 (10%). When mic loopback is skipped, its 200 points redistribute proportionally so the total stays at 1000. Each signal is graded continuously against severity thresholds and contributes to the composite.
Get a letter grade and shareable card
The composite score maps to a letter grade (S 950+, A+ 900+, A 825+, B 725+, C 600+, D 450+, F below) - the same scale used by the Controller Health Score and FPS Score for consistency across the GPADLAB benchmark family. The result panel includes a Share Score button that generates a 1200×630 image with your number, grade, output device, and per-signal breakdown.
What the four signals mean
The four signals are graded independently and weighted into the composite. The reported output latency does most of the work; perception and consistency are the human-perception backstops that make sure the result is meaningful.
| Signal | Threshold (Healthy → Faulty) | What It Represents |
|---|---|---|
| Reported output latency | Healthy < 20ms · Functional < 40ms · Partial < 100ms · Faulty ≥ 100ms | Browser-reported output-path estimate for the active AudioContext. Lower values generally indicate a shorter reported output path, but the number is not a direct laboratory measurement of the physical headphone or speaker alone. |
| Mic loopback round-trip | Healthy < 30ms · Functional < 70ms · Partial < 150ms · Faulty ≥ 150ms | Estimated acoustic round-trip time across the combined output, air, microphone, input, and browser path. It can be compared with the browser-reported output estimate, but it does not independently confirm pure hardware output latency. |
| A/V perception offset | Healthy < 20ms · Functional < 50ms · Partial < 100ms · Faulty ≥ 100ms | Your personal threshold for perceiving audio and visuals as simultaneous. Sharp perception (under 20ms) means you would notice even small latency adjustments. A wide threshold may indicate either an insensitive ear or a noisy trial - re-running gives a cleaner read. |
| Perception consistency | Healthy < 10ms · Functional < 25ms · Partial < 50ms · Faulty ≥ 50ms | Standard deviation across the three sync trials. Low variance means you consistently aligned the click and flash the same way - high variance suggests the result is closer to a guess. The composite score weights this so noisy runs do not dominate. |
Three audio checks, three different meanings
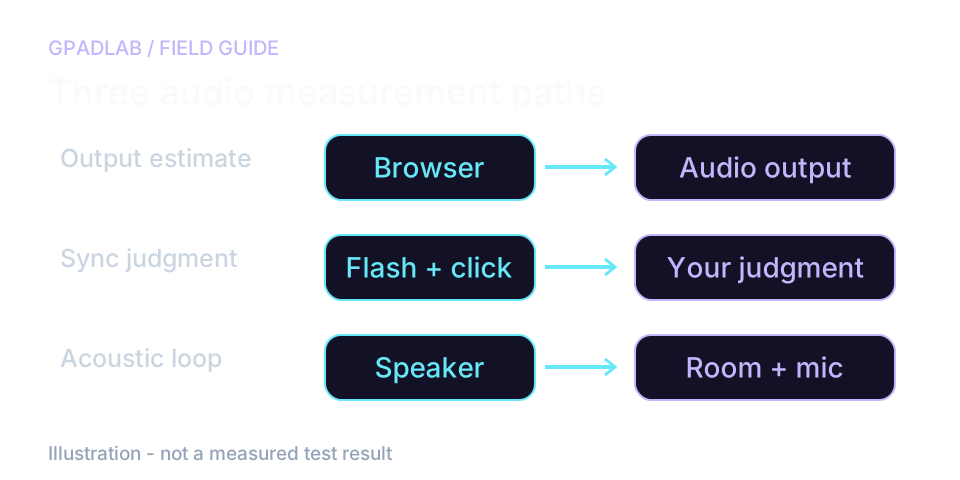
Start with the reported estimate
The browser reports an output-latency estimate where supported. It describes part of the playback path. It does not measure when a particular sound reached your ear.
Treat sync and loopback as separate evidence
The click-and-flash trials depend on your judgment of sync. Use the same output device and room for each trial.
The optional chirp test records through your microphone. Distance, echoes, input processing, and background sound can affect it. If confidence is low, improve the setup before comparing numbers.
Compare like with like
A loopback value will not necessarily match the output estimate. They cover different paths. Save the device and connection details with your result, and compare the same measurement across runs.
Compatible audio setups
The test runs against whatever audio output is currently active. To compare devices, run the test, switch outputs, then run it again - the score difference quantifies what your hardware is costing you.
Related diagnostics
Audio Latency questions
Bluetooth audio is compressed before transmission, sent over a packet-based wireless link, and decompressed in the headphones - each step adds time. Standard SBC codec adds 100-250ms. AAC and aptX cut this to 100-150ms. aptX Low Latency targets under 40ms but requires both transmitter and receiver to support it. Bluetooth LE Audio (LC3 codec) can go even lower. If your test shows high latency on Bluetooth, the codec and chip in your headphones are usually the limiting factor, not the host device.
A click sound and a screen flash play together on a 1.5-second loop. The slider shifts the click forward (right) or backward (left) in time relative to the flash. You drag until the two feel perfectly simultaneous. The absolute value of the offset you choose is your personal A/V perception threshold - a number that depends on your hearing, your visual sensitivity, and the actual latency in your audio chain. Three trials give us a median and a measure of how consistent you were.
Run it if you want to verify what your browser is reporting, or if you suspect your Bluetooth headphones are misreporting their latency (some do). Skip it if you do not want to grant microphone permission, you are in a noisy environment, or you trust the reported value. Skipping does not penalize your score - the 200 points allocated to mic loopback redistribute to the other three signals so the total stays at 1000.
Because they measure different things. Reported output latency is output-only (sound generation to speakers). Mic loopback is round-trip (output through speakers, across the room to your mic, then back into the browser). Expect the loopback measurement to be roughly twice the reported number plus a few milliseconds for air travel. If the loopback is much higher than expected, your hardware or driver may be adding latency the browser is not aware of.
The cross-correlation between the played chirp and the recorded audio was weak, usually because the recorded signal was too quiet (mic far from speakers, low playback volume) or too noisy (room background, other apps producing sound). Try moving your microphone closer to your speakers, increasing system volume, and re-running in a quieter environment. If the issue persists across attempts, the loopback path may be physically blocked (some laptop mics are heavily filtered to suppress speaker bleed).
Under 40ms reported output latency is the practical floor for competitive audio - beyond that, footsteps and abilities start arriving meaningfully late relative to visuals. Under 20ms is what wired audio enthusiasts consider transparent. Above 100ms is where most users start consciously noticing the lag. For ranked play, wired headphones or low-latency wireless (sub-40ms) are the safe choices.
Native or dedicated measurement tools can access lower-level timing information that a webpage cannot. GPADLAB therefore reports browser-observed signals and their limits. The optional microphone loopback adds a useful combined-path estimate because the chirp travels through output, air, microphone, input, and browser processing, but it is not absolute ground truth for the output device by itself.
Yes. The result panel includes a Share Score button that generates a 1200×630 image with your score, grade, output device name (when available), and per-signal breakdown. Mobile and modern desktop browsers open the native share sheet; older browsers copy the image to your clipboard so you can paste it into Discord, Twitter, Reddit, or anywhere else. Sharing the score creates an image you can post or send elsewhere; it does not currently upload your result to a GPADLAB community database. Community percentile comparisons are a planned optional feature.
How we calculate the Audio Latency Score
The page reads available browser latency estimates and runs three click-and-flash trials. An optional microphone test looks for a played chirp in recorded sound. That round trip includes output, room travel, capture, and processing. Low-confidence matches are rejected. The combined score is a GPADLAB guide, not a pure measure of headphone delay.Dedicated methodology article not yet published; see the methodology hub for the methods currently available.