FPS Test - frame rate stress benchmark
This browser FPS test runs four workload levels to show how frame timing changes as load grows. Choose Canvas2D or WebGL, then compare the tiers under the same setup. The score uses a browser-estimated refresh target. It describes this workload and does not predict the frame rate of a specific game.
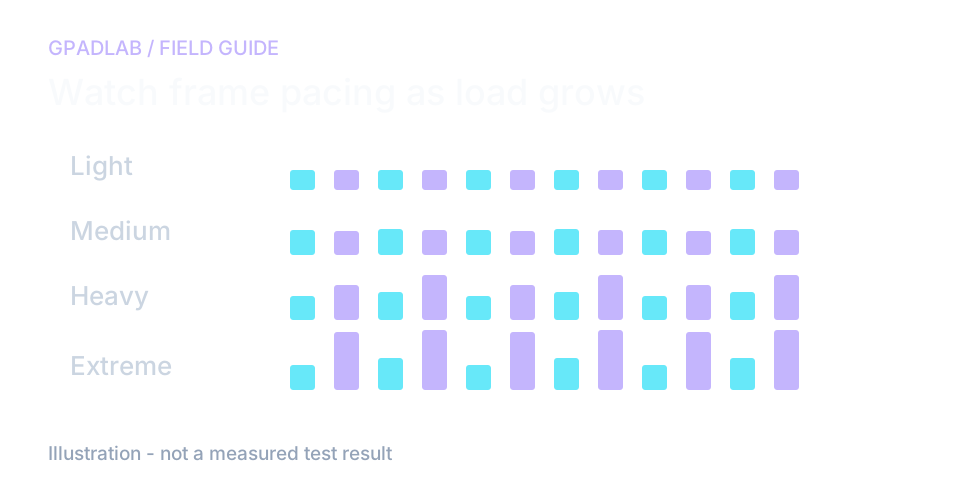
Compare four levels of rendering load
Detect your monitor's refresh rate
Before the tiers begin, the test reads your monitor's refresh rate using the browser's reported value when available, or measures it directly with a two-second frame-timing sample. This becomes the target your machine is scored against - there is no point grading a 60Hz monitor against a 240Hz target it can never hit.
Choose your workload
Canvas2D renders thousands of rotating particles and primarily stresses the CPU and browser rendering pipeline - the meaningful test for most users on most hardware. WebGL renders a raymarched fragment shader and stresses the GPU directly - useful for users with discrete graphics who clear Canvas2D Extreme easily and need a harder workload.
Four tiers run in sequence
Light, Medium, Heavy, and Extreme each run for five seconds with a fixed workload amount. Light is a sanity check - anything modern should max it. Medium separates capable machines from underpowered ones. Heavy is where most gaming hardware lives. Extreme is for the top tier, the workload designed to defeat all but the most capable rigs.
Measure sustained FPS per tier
During each five-second window, the test records a high-resolution timestamp on every rendered frame. The median interval between frames produces a stable sustained FPS reading - not a peak number from a single good moment, but the rate your machine actually held under load.
Score against the refresh-rate target
Each tier's score is the ratio of sustained FPS to your monitor's refresh rate. Hitting 95% or more of your refresh rate is healthy; 80%+ is functional; 60%+ is partial; below 60% is faulty. The four tier scores sum to a 0-1000 FPS Score with a letter grade from S (950+) down to F (under 450).
What the tier scores mean
Each tier is graded against your monitor's refresh rate. Two machines with identical FPS measurements but different displays will receive different grades - the score reflects pipeline saturation, not absolute frame rate.
| Saturation | Rating | What It Means |
|---|---|---|
| Healthy | ≥ 95% of monitor refresh | Pipeline is keeping up with the display. A 144Hz monitor at Heavy holding 137+ FPS lands here. This is the target - your machine is delivering the frame rate your display can show. |
| Functional | 80-94% of monitor refresh | Close to saturation but slightly short. Playable but you are leaving frames on the table. Common on mid-range hardware at Heavy/Extreme tiers. |
| Partial | 60-79% of monitor refresh | Noticeable shortfall. Visible stutter in games at this workload level. Either the GPU is bottlenecking or the browser/OS is throttling rendering. |
| Faulty | Under 60% of monitor refresh | Pipeline cannot keep up. May indicate disabled hardware acceleration, severe thermal throttling, or hardware genuinely incapable of the target rate. Recommend re-testing with browser GPU acceleration confirmed on. |
| Tier weights | Light 100 · Medium 250 · Heavy 350 · Extreme 300 | Heavy carries the most weight because it represents real gaming load on capable hardware. Extreme is weighted slightly lower because only top-tier rigs sustain it. Light is a sanity check worth only 100 points. |
Compare the workload, not just the FPS number
Canvas and WebGL answer different questions
Canvas2D draws a growing particle workload. WebGL runs a graphics workload. A score from one mode should not be treated as the same test as a score from the other.
Use the same browser, window size, and power mode when you compare runs. Close unrelated heavy tasks first.
Browser FPS is not a forecast for a game
A game has its own engine, scene, settings, and frame limits. This page measures its own workload through browser frame callbacks.
The score uses a browser-estimated refresh target. It does not read the monitor's true panel timing. Look at which tier becomes uneven, then repeat that mode to check whether the pattern holds.
Compatible systems
Use a browser that supports the chosen workload. The score uses a browser-derived refresh target. Keep the mode, window size, and power settings fixed for comparisons.
Related diagnostics
FPS questions
A refresh rate test measures how often your monitor itself redraws the screen - a property of the display hardware. An FPS test measures how many unique frames your rendering pipeline produces per second under controlled load - a property of your CPU, GPU, and browser. The two are closely related (and equal under no load) but diverge under stress, and the divergence is what tells you whether your machine can saturate your display.
Because a fixed target would be unfair. Holding 60 FPS at Extreme is a perfect score on a 60Hz monitor but a bad score on a 240Hz monitor - the same machine performance would land in totally different grades depending on which monitor you happened to plug in. By scoring against the display you actually have, the test answers the meaningful question: can your machine deliver the frame rate your monitor can show?
Start with Canvas2D - it is the meaningful test for most users. It stresses the CPU and browser rendering pipeline, which is what limits frame rate on most machines. Try WebGL only if you have a discrete GPU and clear Canvas2D Extreme easily; the WebGL fragment shader stresses the GPU directly and is the harder test. If WebGL is unavailable (hardware acceleration disabled, locked-down browser), the test automatically falls back to Canvas2D with a notice.
Browsers do not have access to the same low-level GPU features as native games. Game engines bypass the browser layer, use compiled shaders, and can leverage features like async compute and multi-threaded rendering that browsers cannot. This test measures the rate your browser sustains under controlled load, which sits well below what a native game can hit on the same hardware. Use this test to compare across machines and over time, not to predict in-game FPS.
The tier loads are calibrated so that Light is a sanity check anything can pass, Medium separates capable machines from underpowered ones, Heavy is where most gaming hardware lives, and Extreme defeats all but the most capable rigs. These numbers will be tuned over time as we collect more results - if a tier feels too easy or too hard for current hardware, expect us to adjust.
Yes, significantly. Other browser tabs, video calls, downloads, and background applications all compete for CPU time and can pull the FPS test below its true ceiling. For the most accurate result, close other tabs and applications, then re-run. The test is repeatable enough that two clean runs in a row should produce scores within about 25 points of each other.
A grade of B or higher (725+) means your machine is generally keeping up with your display under load. A is good. A+ is excellent. S (950+) requires sustaining 95%+ of your monitor's refresh rate across all four tiers - typical only on high-end hardware paired with reasonable refresh rates. A 60Hz monitor will hit S more easily than a 240Hz monitor because the saturation bar is lower in absolute FPS terms.
Yes. The result panel includes a Share Score button that generates a 1200×630 result card with your score, grade, monitor refresh rate, workload type, and per-tier sustained FPS breakdown. On mobile and modern desktop browsers it opens the native share sheet; on browsers that do not support it, the image is copied to your clipboard so you can paste it into Discord, Twitter, Reddit, or wherever else.
How we calculate the FPS Score
Four workload tiers run for five seconds each. The page estimates FPS from frame intervals and scores it against a browser-derived refresh target. Canvas2D and WebGL use different workloads. Keep mode and setup fixed for comparisons. The score describes this page, not expected frame rates in a game.Dedicated methodology article not yet published; see the methodology hub for the methods currently available.