Controller Battery Health Check - live level + charge history
A controller battery health check can start with the current charge level, but standard Web Bluetooth battery data does not expose original mAh capacity or current full-charge capacity. GPADLAB reads the reported GATT battery percentage on supported controllers and saves local charge history so you can compare readings over time. That history shows state of charge, not battery state-of-health, so GPADLAB does not calculate capacity degradation from percentage alone. The page also explains battery-aging symptoms and device-specific ways to check battery information.
Read and save a supported charge level
Pair your controller with the operating system first
The browser cannot initiate Bluetooth pairing - that happens at the OS level. Pair your controller with macOS, Windows, or Android the normal way (System Settings → Bluetooth on macOS and Windows; Settings → Connected devices on Android). Once paired and connected, the browser can read it.
Click Connect - your browser opens a device picker
On the page, click the Connect Controller button. The browser shows a native picker dialog listing nearby Bluetooth devices that expose the standard battery service. Pick your controller from the list. The first time you do this, the browser asks for permission to access the device.
The browser reads the battery characteristic over GATT
GATT (Generic Attribute Profile) is the Bluetooth Low Energy data model. The standard battery service exposes a single characteristic - the current battery level as a 0-100 integer. The page reads it once on connection and displays the level immediately along with a colored ring indicating charge state (green above 75 percent, cyan 50-75, amber 25-50, rose below 25).
Every reading is saved to your browser
Each successful reading is persisted to localStorage with a timestamp and the controller identifier. Multiple controllers track separately - your DualSense and your Xbox controller each have their own history. Up to 100 readings per controller are kept; older ones rotate out. Readings within 5 minutes of each other are deduplicated to prevent accidental noise.
Review charge history without treating it as capacity health
GPADLAB keeps timestamped battery percentages so you can review reported charge history for each controller. A lower percentage on a later visit may simply mean the controller was not charged to the same state. Standard GATT percentage does not expose original or current full-charge capacity, so the browser cannot turn these readings into a valid percent-per-month battery degradation figure.
What the battery levels
The live tool reports the battery percentage exposed by the controller and stores those readings locally. Treat the values as reported state of charge. They do not reveal the cell's original mAh capacity or current full-charge capacity, so the history is not a direct battery-health measurement.
| Reading | Classification | What It Tells You |
|---|---|---|
| 75 to 100 percent | Excellent charge | A high reported state of charge. It tells you the controller currently reports plenty of charge, but reaching 95-100 percent does not prove the battery still has its original capacity. |
| 50 to 74 percent | Good charge | A mid-to-high reported charge level. Remaining runtime varies widely by controller model, battery size, lighting, haptics, radio mode, firmware, and battery age. |
| 25 to 49 percent | Charge soon | Plan to plug in before the next long session. Lithium-ion cells last longer when kept above 20 percent and below 80 percent most of the time, so periodic top-ups beat full-discharge cycles. |
| Under 25 percent | Critical - charge now | Imminent shutoff range. Repeatedly discharging to below 10 percent accelerates capacity loss noticeably, so plugging in at 25 percent is better than waiting until the controller dies. |
| Charge history | Reported state of charge over time | Saved readings help you compare when and how you charge a controller. They do not measure original capacity, current full-charge capacity, cycle count, or battery state-of-health, so GPADLAB does not convert them into a degradation percentage. |
A full charge is not a battery health measurement
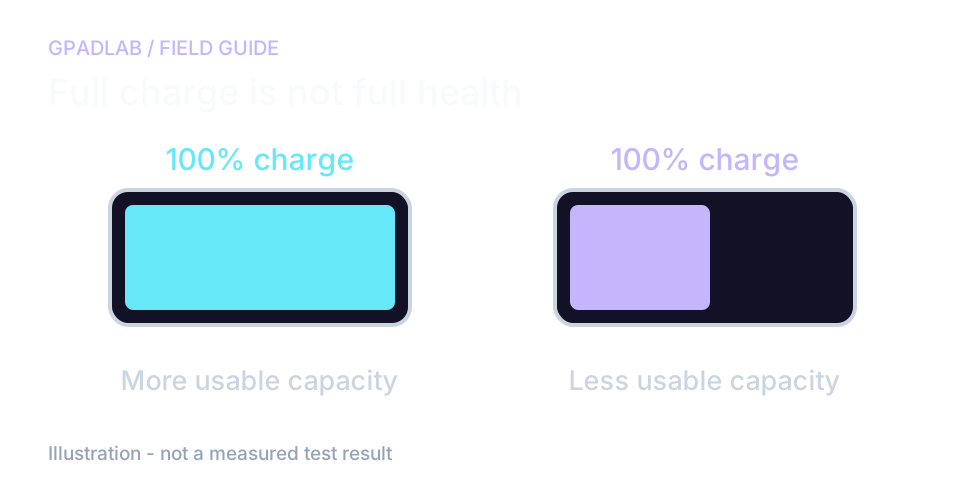
What the battery percentage tells you
A reading of 100 percent means the device reports a full charge. An aged battery can reach that reading while storing less energy than it did when new.
This tool reads one field called Battery Level. Bluetooth has other battery fields too. This tool does not read those fields.
Use history to ask better questions
Track how long each charge lasts. Use the same lights and rumble settings each time. A list of charge levels cannot tell you how much charge the cell can still hold.
No devices in the list? That does not prove a battery fault. Your controller must share its charge level with this browser through Bluetooth. Saved readings stay in this browser on this computer.
Controllers that expose battery
Not all controllers expose battery information over standard Bluetooth GATT. Below is the practical compatibility list - controllers known to work, controllers that do not, and ones that vary by firmware.
If the connection is not working
Related diagnostics
Battery Health questions
Because reading a Bluetooth device from a webpage requires the Web Bluetooth API, which only Chromium-based browsers implement. Safari and Firefox have not shipped Web Bluetooth for security and privacy reasons - those browsers deliberately limit what websites can do with paired hardware. The educational content on this page works in every browser; only the live measurement tool requires Chrome or Edge. Mobile Chrome on Android also supports it; iOS Safari does not.
Three common causes. First, the controller must be paired with your operating system before the browser can see it - Web Bluetooth reads already-paired devices, it does not initiate pairing. Second, the controller must be powered on and currently connected, not just paired-but-off. Third, some operating systems (particularly macOS) require the device to be in an active discoverable state. If the picker is empty, try briefly putting the controller into pairing mode again (press and hold the Share or Sync button until the light blinks rapidly), then re-open the picker.
The live browser feature measures reported battery level and stores charge history; it does not directly measure battery state-of-health or capacity loss. Standard GATT battery percentage does not expose the battery's original mAh capacity, current full-charge capacity, internal resistance, or cycle count. The page can help you interpret symptoms of battery aging, but a valid capacity-health measurement needs additional device or manufacturer data.
GPADLAB displays the 0-100 value the controller exposes through the standard battery characteristic. The precision and smoothing of that value depend on the controller's own firmware and battery-gauge implementation. It is a state-of-charge report, not a direct measurement of remaining mAh or battery health, so use it as an approximate charge indicator.
No, the Switch Pro Controller does not expose battery information through the standard Bluetooth GATT Battery Service. Nintendo uses a proprietary protocol for battery and other peripheral data, which standard Web Bluetooth cannot access. Check the battery on the Switch home screen instead - it appears next to each connected controller. This is a limitation of the controller, not the tool.
Capacity decline means the battery can store less energy at full charge than it could when new. A controller may still report 100 percent because that percentage represents its present state of charge, not a comparison with the battery's original mAh capacity. To quantify degradation, you need data such as full-charge capacity versus design capacity, measured runtime under controlled conditions, or manufacturer diagnostics; a history of percentage readings alone cannot calculate it.
No, in any meaningful sense. The tool reads the battery characteristic once per connection. The Bluetooth radio stays active during normal use whether you read battery or not, so the marginal power cost of one read is negligible. Reading repeatedly with the Refresh button does consume small amounts of power, but you would have to refresh hundreds of times to drain even a single percent.
Readings stay in this browser's local storage. Another browser or computer starts with its own history. Clearing site data can remove the saved readings. Use the same setup when comparing charge history.
How we read battery level and explain battery health
The page reads the Battery Level characteristic from a device that exposes a compatible Bluetooth service. It saves the reported charge percentage locally. The newer Battery Service standard includes other optional data, but this code does not read those fields. Charge percentages alone cannot establish capacity loss, cycle count, or battery health.Dedicated methodology article not yet published; see the methodology hub for the methods currently available.