Trigger Pressure Test - analog trigger range checker
This trigger pressure test checks the input values reported as you pull and release each trigger. It compares rest, full travel, changes during the pull, and recovery. Supported analog triggers can report a range of values; digital triggers may only switch on or off. The tool does not measure physical finger pressure.
Follow the full trigger travel
Connect your controller
Plug in via USB or pair over Bluetooth. Press any button to wake the controller - browsers hide gamepad input until a button press for privacy.
Phase 1 - Resting baseline (2 seconds)
Release both triggers completely. The test averages the value reported during this window. A healthy resting value is below 0.020; anything higher indicates sensor drift or a stuck trigger.
Phase 2 - Travel sweep (8 seconds)
Slowly pull each trigger to its mechanical stop, then release. The test records the entire sample stream to evaluate maximum reach, the worst gap between adjacent samples (smoothness), and any plateaus that indicate dead spots in the sensor range.
Phase 3 - Recovery check (2 seconds)
After release, the test measures how long each trigger takes to return below 0.020. Sticky recovery indicates spring fatigue or sensor hysteresis - a precursor to full failure.
Read your verdict
Each trigger gets its own verdict based on the worst of its four metrics. The composite verdict is the worst of the two. Detailed per-trigger cards show the sparkline, dead-spot ranges, and specific failure reasons.
What the numbers mean
Each trigger is evaluated on four metrics. The worst metric determines the trigger's verdict; the worst of the two triggers determines the overall verdict.
| Metric | Verdict | Threshold |
|---|---|---|
| Resting value | Sensor at rest | Healthy ≤ 0.020 · Mildly worn 0.020-0.050 · Degraded 0.050-0.100 · Failed > 0.100 |
| Maximum reach | Full pull value | Healthy ≥ 0.990 · Mildly worn 0.950-0.990 · Degraded 0.900-0.950 · Failed < 0.900 |
| Travel smoothness | Worst sample-to-sample gap | Healthy ≤ 0.030 · Mildly worn 0.030-0.070 · Degraded 0.070-0.150 · Failed > 0.150 |
| Recovery | Time to return below 0.020 | Healthy ≤ 200ms · Mildly worn ≤ 500ms · Degraded ≤ 1000ms · Failed > 1000ms or stuck |
Check trigger travel without confusing it with force
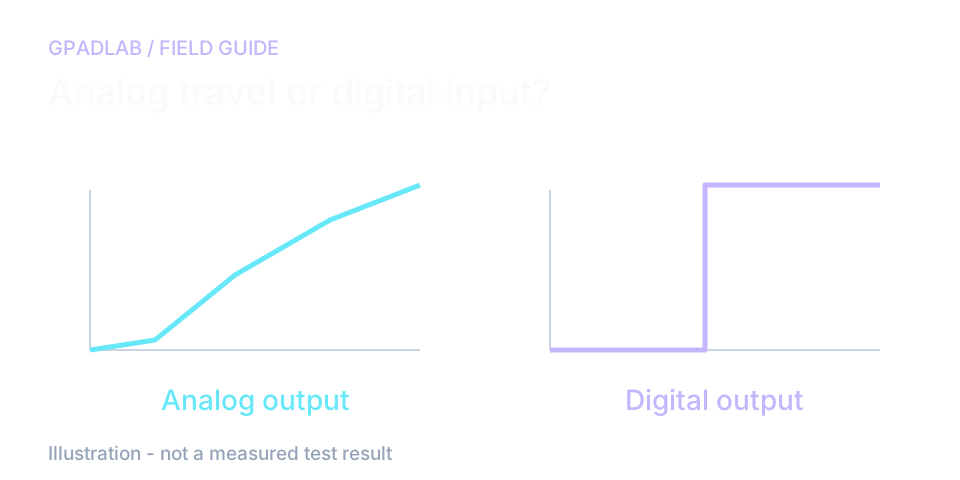
Look for repeatable changes through the pull
Release both triggers for the baseline, then pull each one slowly through its full travel. Release it fully before the next pull. A sudden step can come from your movement as well as the controller.
Disable a trigger stop only if your controller lets you do so normally. Stops and trigger modes can change the range you see.
Some triggers only report on or off
A digital trigger can jump straight from zero to one. That behavior is not the same as a faulty analog trigger. Check the specification for your model.
This test reads input values. It does not test DualSense adaptive resistance or measure pressure in physical units. Use the haptics page to check the feedback the browser can request.
Compatible devices
The trigger pressure test works with any controller whose analog triggers are exposed at button indices 6 and 7. Device guides below can help with setup. Confirm support on your browser and connection before interpreting results.
Common repair guides
Related diagnostics
Trigger Pressure questions
The test checks the values the browser receives through a trigger pull and release. It looks at resting output, maximum reach, changes, and return. These are reported input values, not physical pressure. An unusual result is a reason to repeat and investigate.
The tool uses resting output of 0.02 or less as its first reference band. This is a screening choice. A nonzero reading does not identify debris, spring wear, or sensor damage. Repeat with the triggers untouched and check the model's trigger mode.
Check whether trigger stops or a controller profile limit the output. Pull slowly through the available travel and repeat. A low maximum alone does not identify wear or debris. Compare the input in another app and follow support steps for the model.
A dead spot is a range of trigger travel where the reported value doesn't change despite physical movement. Our test flags any plateau of three or more consecutive samples within 0.005 of each other (excluding the rest and max positions). Dead spots are a hallmark of failing potentiometer-based triggers - the carbon strip inside has worn unevenly. Hall effect triggers are immune to this failure mode.
The value may stay above the reference band because of the release motion, settings, browser sampling, or the controller. Repeat a clean release without resting a finger on the trigger. This reading cannot identify spring fatigue or predict a future failure.
Partially. Our test measures the analog range of the triggers regardless of whether adaptive resistance is active. If your DualSense has active resistance loaded by a game profile, your maximum reach may legitimately fall short - test with the controller in default state. For dedicated adaptive trigger function tests (resistance feedback, weapon-mode haptics), use our separate Adaptive Trigger Test.
Magnetic sensing avoids a resistive contact track, but trigger response also depends on mechanics, calibration, and firmware. Sensor type alone does not guarantee a clean result. Check the exact model specification and compare full pulls and releases.
No. Joy-Cons use digital shoulder buttons (ZL/ZR) rather than analog triggers - they report only 0.0 or 1.0 with no intermediate values. Use our Button Test for Joy-Con shoulder buttons. The trigger pressure test only applies to controllers with true analog triggers, which includes the Switch Pro Controller but not the standard Joy-Con.
How we measure trigger pressure
The page reads the two trigger input values through a rest, travel, and recovery sequence. It checks resting output, maximum reach, changes during the pull, and return after release. Those values do not measure physical pressure. The verdict bands are screening rules and cannot identify a damaged part.Dedicated methodology article not yet published; see the methodology hub for the methods currently available.
Run the GPADLAB Controller Health Score
The Controller Benchmark combines six core diagnostic stages into GPADLAB's site-defined composite score. Use the stage breakdown for diagnosis and the score for repeat comparison.
Run the Benchmark